Graphs
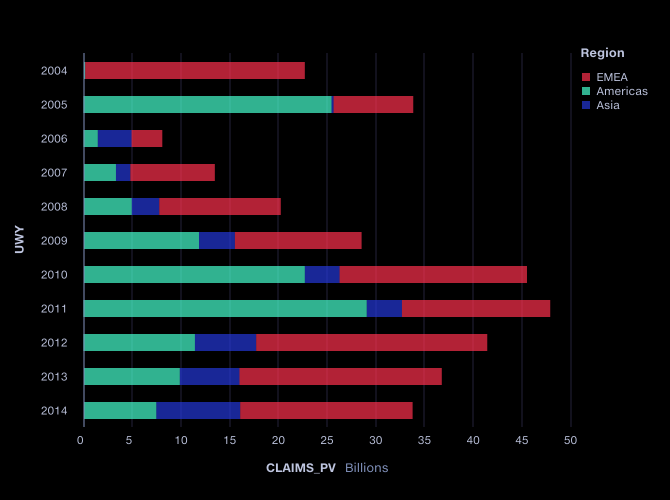
Bar chart

DATA REQUIREMENT
Categories: 0, 1 or 2
Values: 1
Side bar chart
DATA REQUIREMENT
Categories: 0, 1 or 2
Values: 1
Bar-line chart

DATA REQUIREMENT
Categories: 1 or 2
Values: 2
Side-by-side

DATA REQUIREMENT
Categories: 2
Values: 1
Target bar
Target bar charts show a value, displayed as a
bar, measured against a target, displayed as a yellow line. They are
configured as two values, with the left hand value displaying as the bar.

DATA REQUIREMENT
Categories: 1 or 2
Values: 2
Percentage bar
Percentage bar charts show bars segmented by
category, with the length of the bar equalised to the full height of
the chart. Segment percentage labels can also be shown. Percentage bar
charts are useful for analysing differing compositions of bars where
the overall magnitude varies significantly.

DATA REQUIREMENT
Categories: 2
Values: 1
Line chart
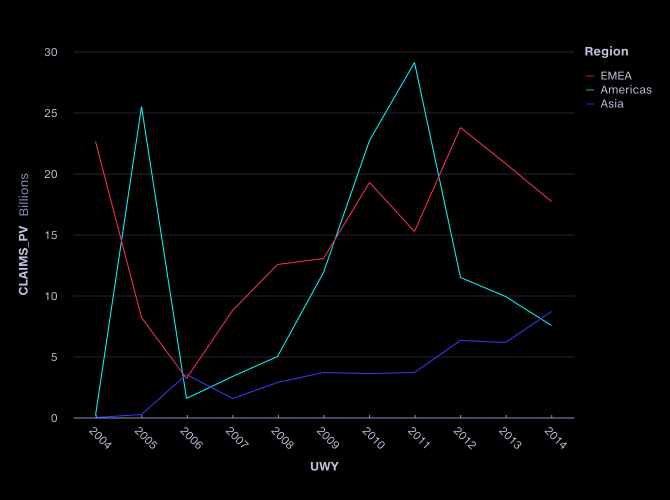
DATA REQUIREMENT
Categories: 1 or 2
Values: 1
Scatter plot
Scatter plots show relationship between two values,
for categories. They have a value on each axis
(e.g. premium and profit),
with categories shown as different coloured dots.

DATA REQUIREMENT
Categories: 1
Values: 2
Pie chart
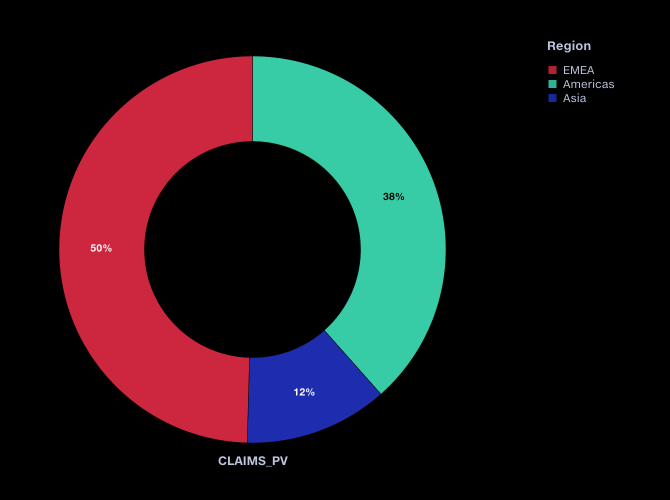
DATA REQUIREMENT
Categories: 1
Values: 1
