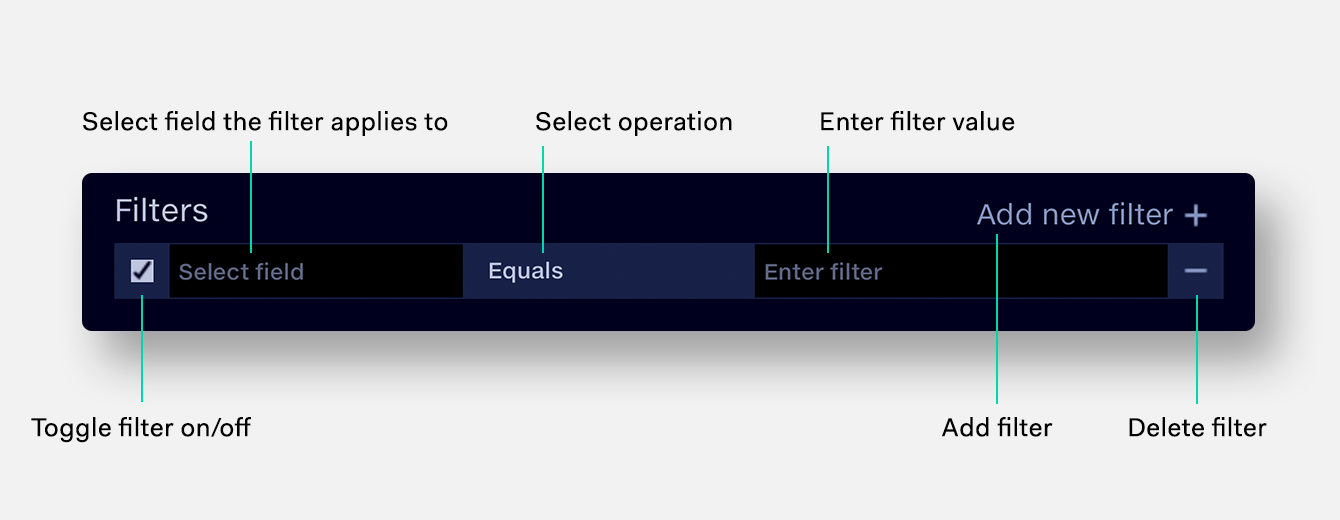
Filter bars allow you to filter down the data in your pivot,
to show specific ranges or categories.
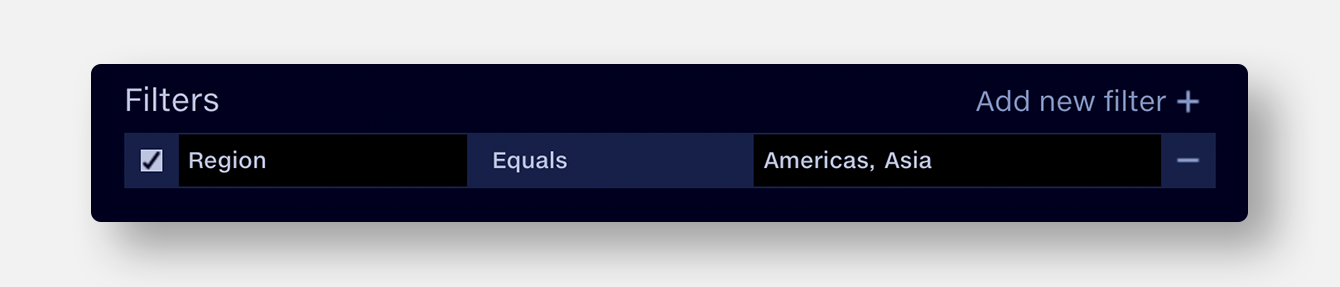
Example filters
Show data from Americas and Asia only
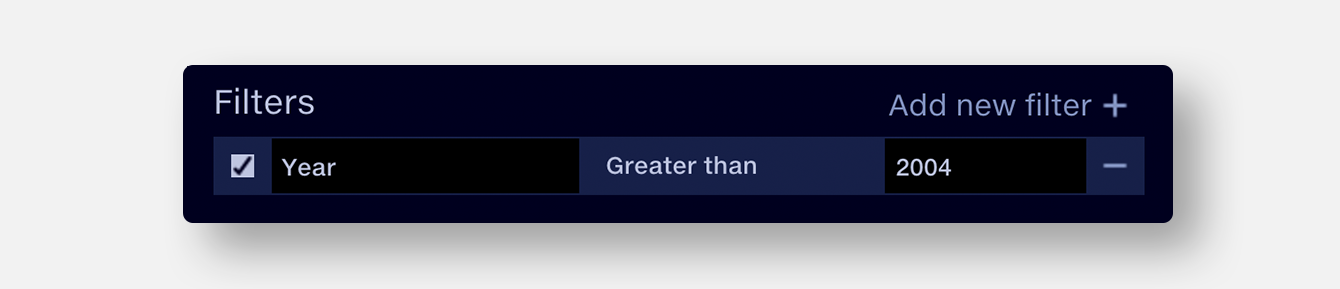
Show years from 2005 to present
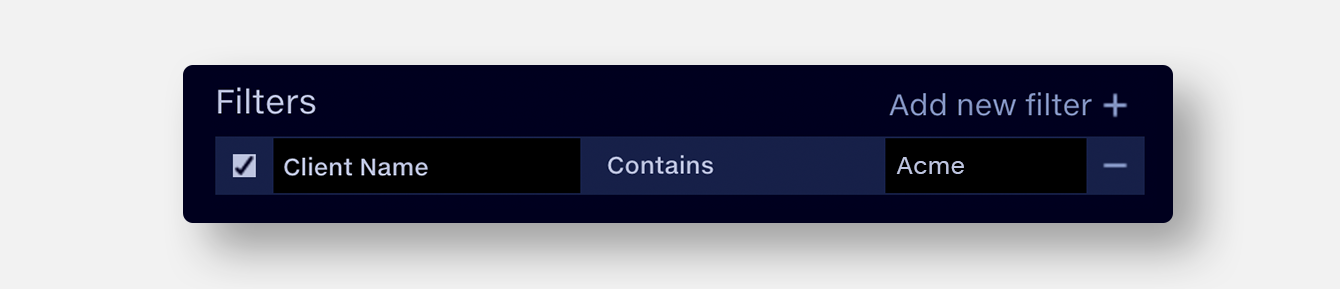
Show only business from Acme group companies
Add filters
1.
Click ‘Select field’ and choose from the list of fields in your data source.
2.
Select the operation. By default it is set to ‘Equals’.
3.
Enter the filter value. A list of the values in the selected category field –
select from this or enter free text or values.
Delete filters
Click the delete button [ – ] at the right end of the filter bar.
Toggle filters
Click the check box at the left end of the filter bar to toggle filters on and and off.
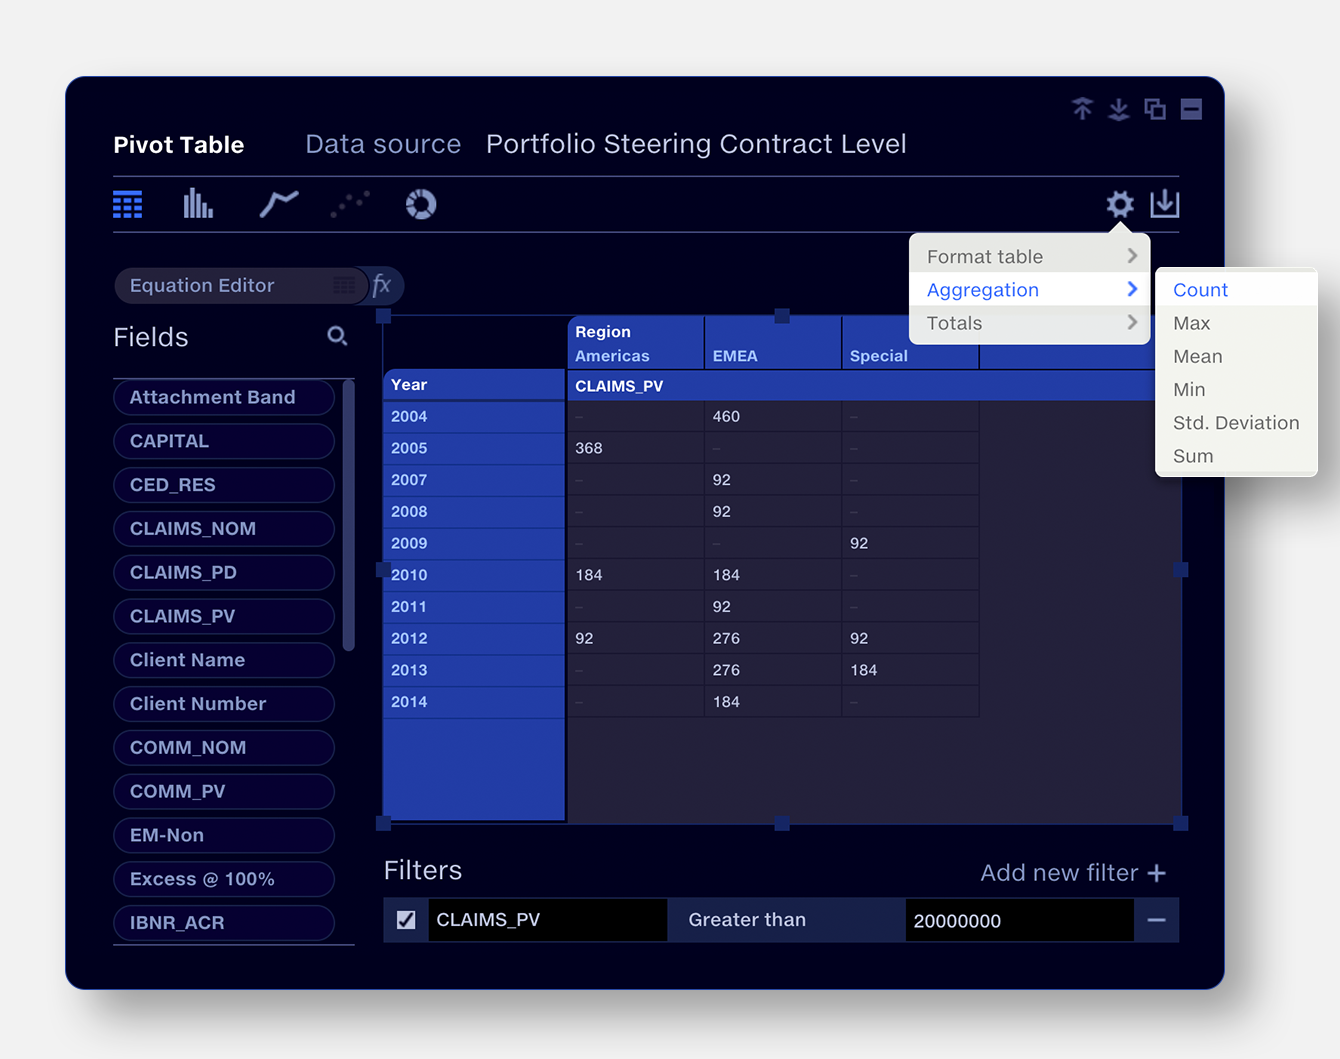
Filtering value fields
When filtering a value field, the filter applies to the raw data, not
the aggregated value displayed in the pivot table.
Example filters
Show number claims greater than $20m by region
‘Claims’ ‘Greater than’ ‘20000000’
Aggregate by count
Segment by region
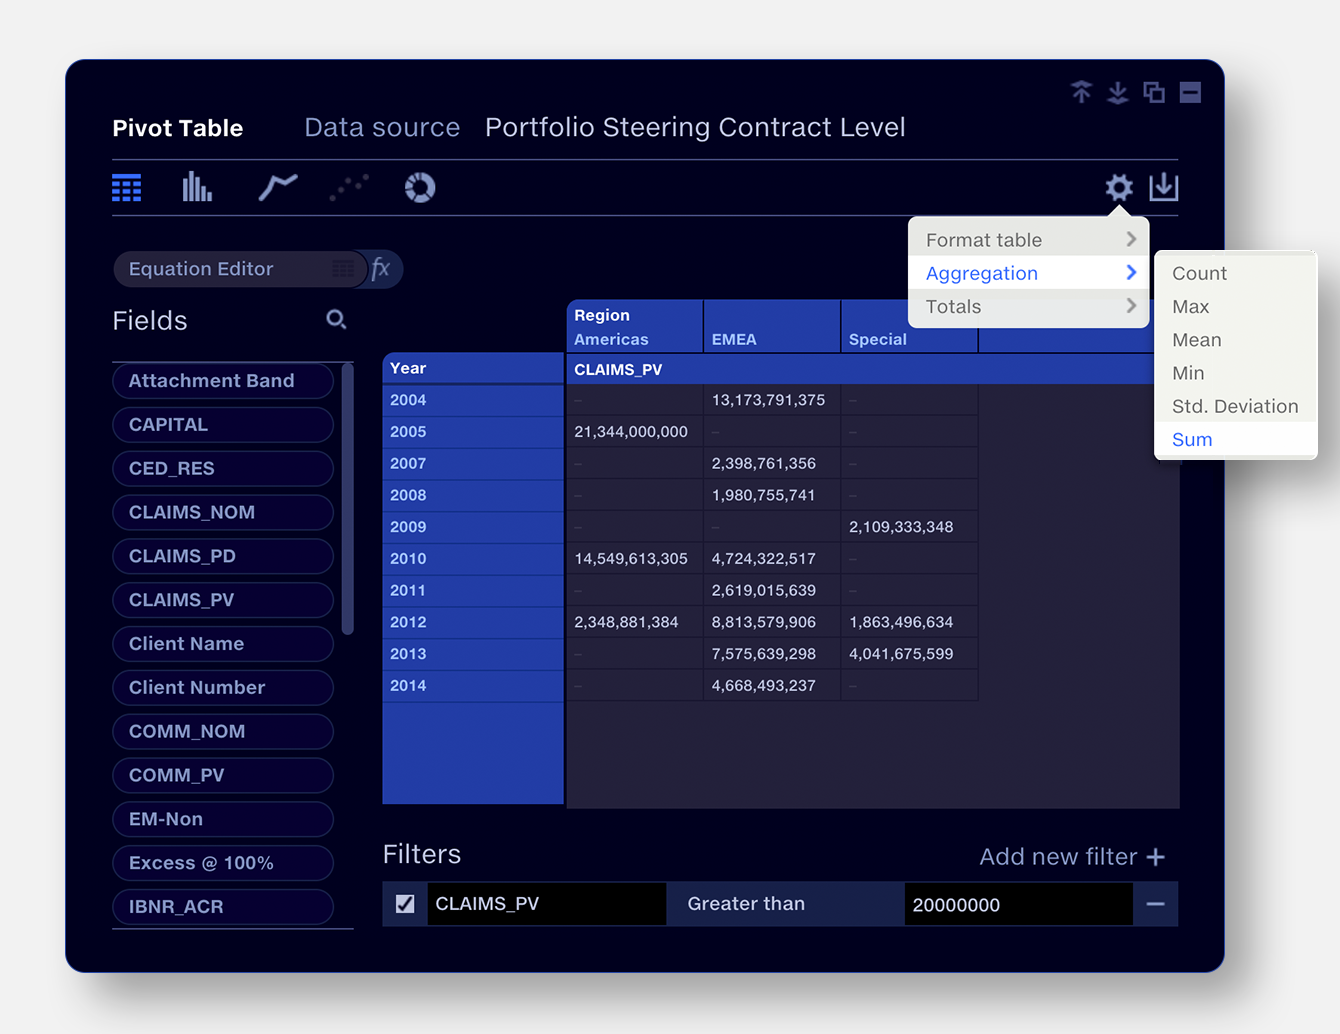
Show total value of claims greater than $20m by region
Claims’ ‘Greater than’ ‘20000000’
Aggregate by sum
Segment by region
Note that the filter entry field does not support commas in numbers.
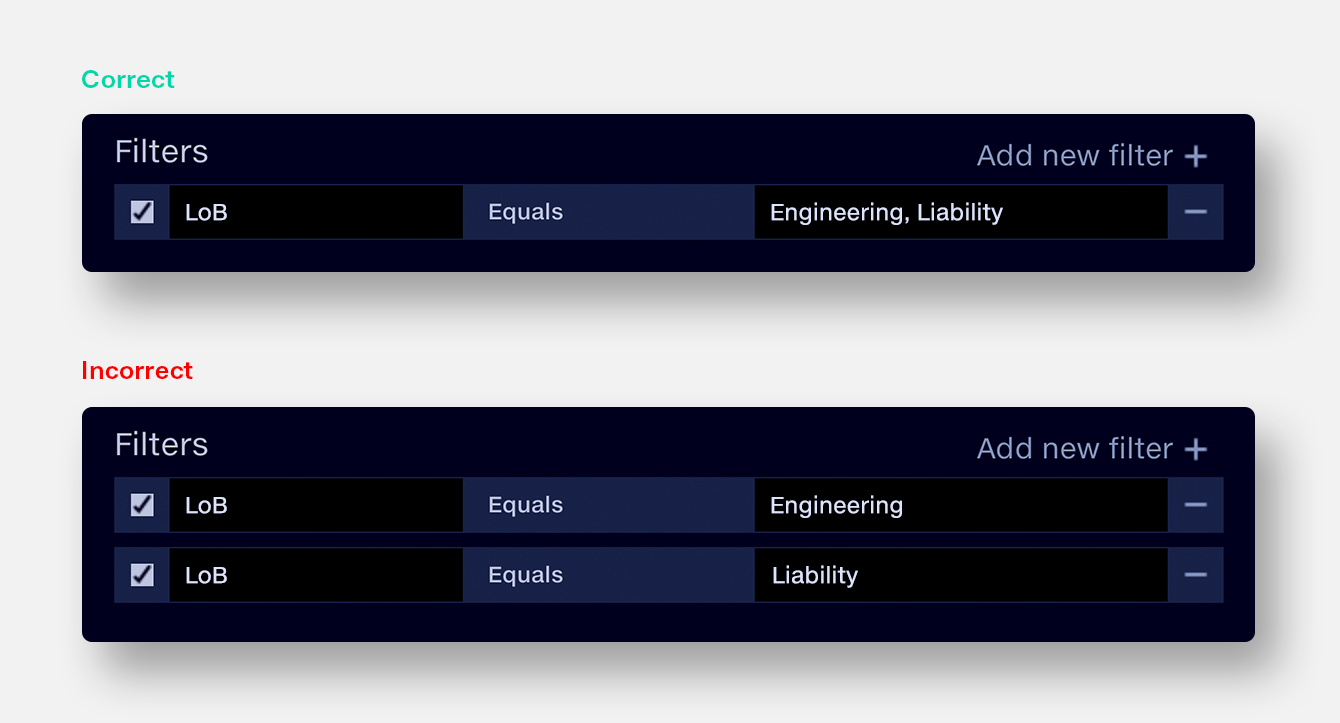
Filter order
Filters apply cumulatively, from top to bottom.
Example
Show only Engineering and Liability Lines of Business.
In the incorrect example, the ‘Engineering’ filter applies over the ‘Liability’ filter,
filtering out all the data.
Advanced filters
Not empty
Not empty filters out rows in categories where the value is empty.
Example
If we configure a pivot with category ‘Policy’, and values
‘Premium’ and ‘Claim’, we can hide Policies which do not contain a claim.
Showing top and bottom
Show only the top or bottom n results of the pivot
query, e.g. Top 10 Claims by Line of Business.
1.
Select the category to filter by
2.
Select the operation Top or Bottom
3.
Enter the number of results, e.g. Top 5
4.
Add further segmentation if required by adding more categories
Where only one category and value are shown, results
are sorted by magnitude (large to small). Where more than one category is shown
results are sorted alphabetically (or chronologically) by category.
Multiple values can be added to a Top/Bottom filtered table.
The filter will only apply to the left hand value column.
Ranking
The Rank filter shows items of a specific rank or range of
ranks, for example the fifth largest, or the sixth to tenth largest items.
Example
Configure a pivot of Sub Regions and Claims. Show the
Sub-Region with 5th highest total Claims.
Now show the Sub-Regions with total Claims ranked 6–10 by magnitude.